Since the last prompt was flow charts, let’s continue charting our way to poems (SO SORRY, I do like bad puns, the worse the better!) Venn diagrams are useful in illustrating the relations among a set of data points or categories. One of my mentors, Danielle Mitchell, discussed at a previous Poetry Lab workshop that she found making Venn diagrams helpful in her creative process. She even uses a Venn diagram for The Poetry Lab website:
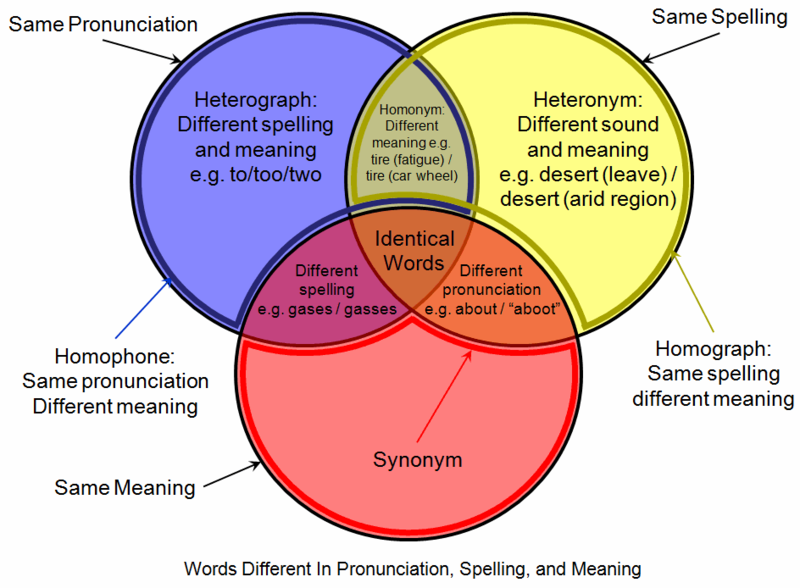
What I am interested in is how a Venn diagram can display common ground among concepts. How do they relate? Below is a homograph homophone Venn diagram created by Will Helmsley and available at Wikipedia.
Choose three emotions—fear, desire and resentment for example—and add images or memories that evoke one of them and add to the corresponding circle. See what touches and what lands in the middle. If each of these emotions had voice, what would it say? What is the conversation among them? Which one is the most vocal, which the most silent. Which gives the most ground?
To perhaps help you visualize that conversation, click on Academo’s Venn diagram generator link here. You will be able to name each of the circles and use sliders to adjust the cardinality (number of elements in the set) and the intersectionality, but of course the images/memories will have to be handwritten onto the relevant section. I hope this gets you started somewhere new and exciting! Click on Brian Bilston’s Venn diagram poem “Employment Relations 4.0” for an example.


